
Intro to Shepherdly's Risk Score
Overview
Shepherdly provides bug prediction at the pull request level for software engineering teams to help them focus their remediation efforts, minimizing bug impact in production.
This is accomplished by training on each team's unique bug-fix data. At a high level, each PR is scored with a Risk Score from 0-100 indicating its likelihood of causing a bug.
Interaction points
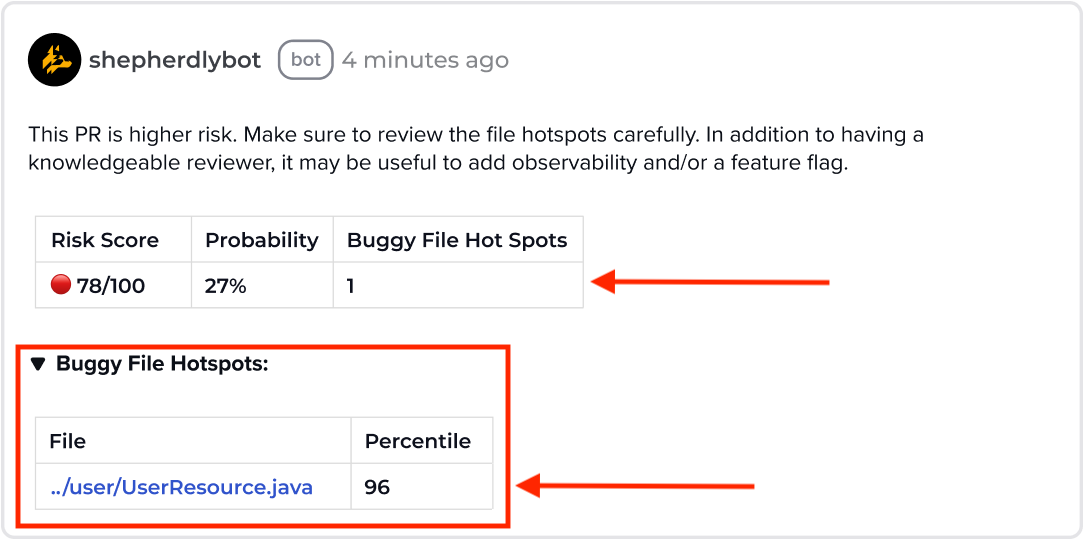
Most engineers will interact with Shepherdly's prediction within the Pull Request flow via the bot comment. This comment may change as the PR evolves with both code changes and review activity.
Additionally, there is a web app view available that provides additional insight into the total predicted bugs and the velocity at which those are being merged into the codebase.
How it works
Shepherdly extends existing academic research on the topic of defect prediction. Foundationally, this technique first starts with classifying bug-fix PRs. This is done through a combination of human labels like associating an issue tracker key to the PR or through NLP.
Second, a line-by-line lineage is built to understand how the lines being changed in the bug-fix PR were introduced. This produces the bug-inducing change label that will drive the predictive model.
The third and last step is creating model features around available metrics like the size of a change, code churn, file age, review activity, and familiarity with the modified files, just to name a few. This is accomplished by ingesting all pull requests since the inception of the repository.
Interpreting the Risk Score & Probability

The Risk Score is on a scale of 0-100. It represents the likelihood the PR will cause a bug. The score is a scaled value based on the raw statistical probability to make it easier to quickly understand the severity. The probability is displayed for those who prefer to deal with the raw data and for transparency.
Depending on the percentage of bug-fix PR's in a repo, the score and probability values may be close together or far apart. In either case, the Risk Score serves as a relative measure of risk.
Another way to think about the inputs into the Risk Score is it's effectively finding similarities to the PR to other PRs it was trained on in the past and assigning risk and probability values based on those attributes. Since Shepherdly is a probabilistic model, there will of course be false positives. However, over even a modest sample size, the model will converge on true positives netting the team beneficial opportunities to reduce their production bug impact.
Acting on the Risk Score
The main objective of the Risk Score is to apply existing remediations commensurate with the score itself in order to adequately minimize production bug impact as opposed to trying to reduce the risk score itself.
The reasoning behind encouraging remediation vs attempting to reduce the score is for two reasons. First, some of the predictive model features that powered the prediction may not be mutable by the author (i.e. current bug proneness of the underlying files). Second, a core principle of the product is to acknowledge that some aspects of software engineering are inherently risky and the best thing we can do is be aware of that risk and apply reasonable safeguards in order to minimize any consequences that could occur in production.
The outcome of successful remediation is to dramatically reduce Mean Time to Detect (MTTD) and the number of customers impacted.
Engineers are aware of how costly extensive remediation efforts are which is why having an objective measure to supplement intuition is useful to justify such an expense. How a team decides to apply the spectrum of remediation will vary by team but as an illustrative example, it could take on the form below:
Risk Score |
Remediation Action |
0-49 |
|
50-75 |
|
76-100 |
|
Interpreting File Hotspots
Overview
Buggy File Hotspots are files that have the highest and most recent bug fixes. This is an indication of bug proneness and stability. If a file you modified is flagged, give a more thoughtful review of what is changing and if the change has a corresponding automated test.
How it's calculated
File Hotspots are a measure of bug proneness by tracking the frequency of bug fixes occurring in the file. A higher bug-fix frequency often translates to a higher percentile rank. Only production executable files that have undergone a bug fix are ranked in the percentile distribution and this feature only calls attention to the 90th and above percentile. This threshold is configurable.
The backing hotspot score is calculated using an exponential time-decaying function. A bug fix in a file increments the score but it immediately starts decaying as a gesture towards assuming the file's bug proneness is either improving or resolved. However, if a file encounters a high density (i.e. 1-2+ a week for several weeks) it won't have enough time to decay and drop out of the File Hotspot list. This puts the most problematic files at the forefront for consideration by the team.
Since the underlying score that powers the percentile rank is constantly changing either decaying or increasing as new bug fixes are merged, it's important to note that a given file that is presently in the 99th percentile, may not be there in the future.